Tuesday, August 25, 2009

Spectrum nominalism

James Franklin’s discussion of nominalism vs. realism on the Philosopher’s Zone struck me as relevant to my obsession with “spectrum” as a concept.

“To be realist about some concept is to say that there is such a thing, and it's not just made up by us, whereas to be nominalist, is to say it's just a way of speaking of ours, from the Latin 'nomen' word, just an empty sign. So for example, in the case of forces I was arguing for realism about forces. When you felt them by pressing the fingers together, you would naturally conclude from that that there is such a thing as forces. On the other hand you'd never be tempted to do that with something like the average Londoner. Scientists tell you that the average Londoner has 2.3 children; you're not tempted to think that that's anything except a way of speaking, that there's some individual entity called the average Londoner, that has 2.3 children. So it would be natural to take a realist view of forces, but a nominalist view of the average Londoner. There's this question about all the entities talked about in science. A classic case is numbers, so that's a very difficult one. Are there such things out there as numbers or are they just a way of speaking about the divisibility of things into parts or something?”
I’m a nominalist about spectrum: I believe “spectrum” is just a way of speaking and does not have a referent in world. Most people, on the other hand, seem to be knee-jerk realists – “Of course there's such a thing as spectrum!” – though often when you start digging they become nominalists: “Of course, I don’t just mean frequency, there are lots of other factors…”

This fine philosophical distinction matters: If one takes the realist position, you behave as if there is a resource (spectrum) to be divided up and allocated, which leads ineluctably to radio licenses defined by hard frequency boundaries.

The nominalist perspective offers another way to thinking about the situation – for example, coordinating the operation of radio systems – that is just as valid. From a nominalist perspective the “coordination” view is just as (in)valid a perspective as “resource” view, and radio licenses don’t have to be defined primarily in terms of frequency and geography.

(See also my earlier post “Newton, Leibnitz and the (non?)existence of spectrum”. There the distinction was between the “absolutist” position that time and space are real objects in themselves, or the “relationalist” position that they are merely orderings upon actual objects that do not exist independently of the mind that is making the ordering.)

Saturday, August 15, 2009

How many poor people are there?

Scott Forbes linked me to a thought-provoking 2005 article titled "How not to count the poor"by Sanja Reddy and Thomas Pogge at Columbia University (PDF). The bottom line is that the simple question of how many poor people there are in the world is surprisingly hard to answer.

Reddy & Pogge argue that "[t]he World Bank’s approach to estimating the extent, distribution and trend of global income poverty is neither meaningful nor reliable. The Bank uses an arbitrary international poverty line that is not adequately anchored in any specification of the real requirements of human beings. Moreover, it employs a concept of purchasing power "equivalence" that is neither well defined nor appropriate for poverty assessment. . . In addition, the Bank extrapolates incorrectly from limited data and thereby creates an appearance of precision that masks the high probable error of its estimates." Furthermore: "There is some reason to think that the distortion is in the direction of understating the extent of income poverty."

(A rebuttal by Mark Ravallion at the Bank can be found here.)

Their alternative: construct poverty lines in each country using a "common achievement interpretation". Such poverty lines would use the local costs of achieving universal, commonly specified ends like being adequately nourished. (Ravallion argues this is pretty much what countries already to do create national poverty lines.)

Reddy & Pogge argue that such poverty lines "would have a common meaning across space and time, offering a consistent framework for identifying the poor. As a result, they would permit of meaningful and consistent inter-country comparison and aggregation."

The catch seems to be that such an approach requires one "to carry out on a world scale an equivalent of the poverty measurement exercises conducted regularly by national governments, in which poverty lines that possess an explicit achievement interpretation are developed." This is difficult politically, since a common core conception of poverty will have to be agreed, and financially, since local poverty commissions in each country would have to be funded to construct and update poverty lines over time.

The authors don't claim that their metric would lead to substantially different, or better, policies. Better then, perhaps, to spend money on poverty-focused development assistance rather than improving the metrics. However, the Bank should be more honest about the flakiness of its numbers by at least not reporting them "with six-digit precision".

Saturday, August 01, 2009

Is it, or isn’t it?

Humans are inveterate classifiers. We can’t help ourselves, it seems: we just have to put things in hard-edged categories. Computing might help to blur the edges in a useful way.

An update on the Pluto controversy in New Scientist is a case in point. Discoveries of exoplanets and the anticipation of Earth-size objects in the Kuiper belt make the argument increasingly irrelevant, but yet even professional astronomers seem caught up in arguing for one definition of planets or the other.

Sensory systems like ours are complicated webs of classifiers: whether objects are moving or still, whether movements are animal-like or not, whether something is a face, whether a sound is speech or music, whether someone is a member of our group or not, and endlessly on. Categorization is innate and unavoidable.

But once embedded in culture, it can quickly spiral out into fraught territory. Problems arise because classification has consequences, often monetary, often political. Is that bond AAA or AA? Is that car a clunker or not? Is so-and-so in a special group, or not? Is that judge biased?

The difficulty arises because there are so many parameters that could be used for any classification; people argue about which parameters should count. Does roundness a planet make, or size, or not orbiting around another one, or having swept its orbit clear of other rocks? Cognitive limitations (the four-or-less rule, see e.g. Halford et al. (2004), “How many variables can humans process?” Psychological Science, 16, 70-76) mean that we end up picking a few criteria from the many – too few. And then we require that each criterion must yield a yes/no result, which even for hard science classifications can be contentious: what does it mean for a planet candidate to have “a nearly round shape”?

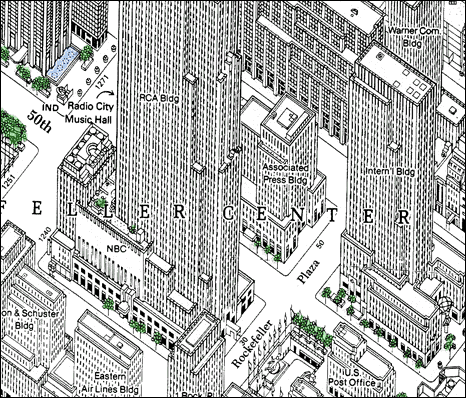
Computing can help by allowing many more criteria into the mix, and allowing them to vary continuously. This is an application of Edward Tufte’s design strategy “to clarify, add detail,” which he introduces in Envisioning Information (1990, p. 37) with the example of The Isometric Map of Midtown Manhattan. Human nature means we may be a little uneasy with the result, but perhaps we can learn to live with it; most people are comfortable nowadays with weather forecasts that say there’s a 50% chance of rain tomorrow (although many may not actually understand what it means ...).

Hiding the criteria has its own dangers. As Bowker and Star argue in Sorting things out: classification and its consequences (1999), any classification encodes a world view, and even “simple” classification systems succeed in making themselves invisible.

Still, with a little more computing we could, in response to the question “Is it, or isn’t it?” answer in a rigorous way, “Ish.” Computers can handle composing dozens or hundreds of continuous criteria in ways our (conscious) brains cannot.

Wednesday, July 29, 2009

Boggle: measuring how sunshine alters the moon's orbit

The July 11, 2009 issue of New Scientist ran a series of stories of why the moon still matters to astronomy, in celebration of the thirtieth anniversary of the Apollo 11 landing. One of them, by Stuart Clark, described how reflectors left on the lunar surface are helping test Einstein's theory gravity. Laser pulses bounced off these reflectors allow researchers to measure the distance between the earth and the moon to a precision of a few millimetres.

At such accuracy one has to factor in the effect of solar radiation pressure "which pushes the moon's entire orbit from its calculated path by about 4 millimetres."

Monday, July 27, 2009

No opponents, but few advocates: Refugee resettlement is like ending hunger

In another installment of her fascinating series on a refugee family resettling in America, Mary Wiltenburg analyzes the big picture in What it’s like to be a refugee in America (Christian Science Monitor, July 19, 2009).

The policy challenge is strikingly similar to the one of ending poverty and hunger in the world. America is remarkably generous (The US, Canada and Australia last year took in 92% of the world's resetlled refugees), but the scope of the problem is tremendous: the US, for example, will resettle about 75,000 people, but 13.6 million others worldwide are living under or seeking UN protection. The American system is creaking: new arrivals received assistance for 24 months when the current system was installed thirty years ago in the Carter Administration, but that's down to a maximum of eight months today.

Wiltenburg's political analysis applies to hunger and poverty, too:

"Refugee resettlement is a tiny program in the grand scheme of Washington. It has no real opponents, but advocates all have higher priorities and the refugees themselves have no political clout. It’s widely agreed that the program’s funding is due for a radical increase [but] how any politician will weigh the moral and political costs against the financial one is still a question."

National security rationales are often used to lobby for international relief programs of all kinds, but the logic is usually tenuous. The true motivation is compassion and generosity, which is unfortunately antithetical to the competitive tussle over resources that is the essence of politics.

Wednesday, July 15, 2009

Factoid: America has < 5% of the world’s people but almost 25% of its prisoners

Source:"A nation of jailbirds," Lexington opinion column in the The Economist, 4th April 2009.
"It imprisons 756 people per 100,000 residents, a rate nearly five times the world average. About one in every 31 adults is either in prison or on parole. Black men have a one-in-three chance of being imprisoned at some point in their lives."
The first half of the story is a searing list of statistics on the brutality and ineffectiveness of the US prison system. But the point is that there's a politician who seems to have taken up this most unpopular of all issues in a democracy (after the rights of sex offenders): Sen. Jim Webb of Virginia.

Monday, June 15, 2009

The Radio Rain Gauge

It’s hard to manage what you don’t measure, and regulators have precious little data on radio operation. Information gathering by citizen enthusiasts could make a huge difference. Riffing on amateur weather stations, it’s easy to envisage a network of “radio rain gauges”.

The need

Information on radio operation is an important part of managing wireless systems. Individual licensees can do this reasonably well, but national regulators are flying blind. The case for better monitoring is clear. The 2002 FCC Spectrum Policy Task Force Report called for better information to more accurately characterize radio operations; Ofcom reviewed automatic monitoring systems in 2006 with a view to increasing concurrent operation where it is lacking, and policing unlawful operation. [1] There have been a number of influential measurement campaigns of radio operation with a view to measuring “spectrum utilization” (I use quotes because neither term is well defined) in recent years, notably Shared Spectrum and CRFS. [2] The case for measurement has received a fillip in the US recently via a bill in the Senate, the “Radio Spectrum Inventory Act” which requires the NTIA and FCC to “inventory” of each radio spectrum band they manage, from 300 Megahertz to 3.5 Gigahertz, every two years.

Precedents and models

Centralized measurement is limited by scope, budgets and politics. The obvious complement is a citizen network dedicated to continuous measurement, and there is a strong precedent: amateur weather stations. For example, someone in my neighborhood has put up a very impressive weather site. The Northwest Weather Network is an Internet based group of private weather stations in Washington, Oregon, Idaho, and Montana that aggregates weather information on its web site. The Citizen Weather Observer Program (CWOP) is a private-public partnership with over 8,000 members world-wide that collects weather information contributed by citizens, and makes it for weather services and homeland security.

There are also public/private collaborations in weather monitoring that could have analogs in the radio monitoring space. AWS Convergence Technologies, Inc. claims to have deployed 8,000 WeatherBug Tracking Stations and more than 1,000 cameras primarily based at neighborhood schools and public safety facilities across the U.S. It says WeatherBug started in the education market by pioneering a program which installed professional-grade weather stations at schools then networked them together; since 2002, WeatherBug’s application has come pre-installed on HP and Compaq computers, and Logitech peripherals.

Weather enthusiasts know about building and managing monitoring stations, and sharing data. Most of them probably don’t know a lot about radio – but the hams do. The American Amateur Radio League, for example, is a nonprofit with 156,000 members that promotes interest in amateur radio communications and experimentation. .

Building out the radio rain gauge network could provide new inspiration and motivation for both weather enthusiasts and radio amateurs.

This will only work if the equipment is cheap. Fortunately, the relentless improvement in computer technology means that mainstream PCs will soon be able to do sophisticated radio monitoring. The free GNU radio software toolkit [3] has been available since 1998, and one can buy the add-on hardware required (one still needs a radio tuner) from Ettus starting at $700 for a basic kit. Most hobbyist software radio projects focus on building receivers rather than transmitters, and a radio rain gauge is an RF spectrum analyzer by another name – which is a straightforward “Hello World” application that’s included in the most software-defined radio packages.

The Radio Rain Gauge Network

This leads to radio band observation running as a background task on thousands if not millions of personal computers. Screensavers have been using spare compute cycles for years to tackle tough academic and public-interest problems; for example, http://distributed.net/ started in April 1997, and SETI@Home was released to the public in May 1999. The infrastructure for collecting data from thousands of PCs is therefore already in place. [4]

A data aggregator will be an important component of such a network. It will also help to have standard formats and repositories so that anyone can get access to the data. This might be done by an academic institutions (cf. BOINC’s role in the cycle-scavenging screen saver endeavor), or it could be end-user driven like the Citizen Weather Observer Program.

Caveats

It’s easy to imagine unease in some quarters about such initiatives. National security operations would prefer that their waveforms and operations not be open to scrutiny and analysis (cf. sensitive areas blurred out in Google Maps), and radio regulators (prompted by nervous incumbent operators) may try to limit the operations of software-defined radios. However, once the knee-jerk negativity has died down, the value of the data collected and the energy of enthusiasts will carry the day. Further, receive-only installations (like radio rain gauges, i.e. spectrum analyzers) are less scary because they do not transmit a signal that could interfere with other operations.

It is also true that the interpretation of the data gathered by radio rain gauges is tricky. Two frequently cited metrics are efficiency and occupancy. The FCC’s Spectrum Efficiency Working Group concluded in 2002 that “it is not possible, nor appropriate, to select a single, objective metric that could be used to compare efficiencies across different radio services” because “the difficulty in calculating some of these variables (for example, the capacity and number of users), and the assumptions behind these calculations, make measures of spectrum efficiency highly unreliable.” John MacDonald, reporting on a 2007 survey of spectrum utilization in Chicago, concluded that “there is a need for a better metric of spectrum utilization than spectrum occupancy which can lead to [erroneous] conclusions as [to] the availability of free spectrum.” Finally, a measure of the intensity of radio operation is not the same as its productivity. One desirable metric would be the aggregate value of information transmitted; however, it is impossible to compute it since there are so many incommensurable measures of value. In the end, though, the current lack of real-time, widely gathered data is so profound that any new information will improve decision making.

Finally, radio frequency engineering is a black art. Building and calibrating the “RF front end” that connects the digital world of the computer to the analog world of radio signals requires expertise that lies outside the software realm, and high sensitivity receivers with low noise and an ability to handle both strong and weak signals will be expensive. A class of “pro” equipment that consumer devices cannot match will remain.

References

[1] National regulators on the need for monitoring. In both cases, regulators framed the problem using the spectrum metaphor as measuring “spectrum use”. FCC Spectrum Policy Task Force (2002): Task Force Report; Report of the Spectrum Efficiency Working Group. Ofcom reports on automatic monitoring systems: Phase I (July 2006), Phase II (Dec 2006)

[2] Measurements. Spectrum occupancy measurements from January 2004 until August 2005 done by Shared Spectrum Corporation for the National Science Foundation (NSF) under subcontract to the University of Kansas. Ofcom (2009) “Capture of Spectrum Utilisation Information Using Moving Vehicles,” Report by CRFS, 30th March 2009.

[3] GNU Radio: introductory article by Eric Blossom ; Wired story; Wikipedia; GNU Radio project documentation, more.

[4] Worldwide distributed computing: List of projects; survey article in Science.

Saturday, May 23, 2009

Factoid: 78% of bottom-quartile employees don't have employer-provided health coverage

-- From a McKinsey analysis reported in their Chart Focus Newsletter, May 2009. It reports "growing disparities in the percentage of employees at different income levels receiving employer-paid health benefits: only 22 percent of employees in the lowest income group (earning an average of $14,800 a year), but 56 percent, 81 percent, and 89 percent of those in the lower-middle, upper-middle, and top income groups, respectively."

Monday, May 18, 2009

Factoid: more Americans are killed every year by preventable medical mishaps than breast cancer or AIDS

From an Economist special report on health care and technology, April 18th, 2009

A report by the Institute of Medicine estimated that up to 100,000 Americans are killed each year by preventable mishaps such as wrong-side surgery, medication errors and hospital-acquired infections—a larger number than die from breast cancer or AIDS.

Flying Blind, The Economist, April 16th 2009

The story continues:

Sometimes such errors can be prevented without fancy technology. It helps to write “not this leg” on a patient’s left leg before surgery on his right leg. When Kaiser Permanente’s innovation laboratory looked into errors in medication dosage, it found that a lot of them were due to interruptions. Now nurses preparing complex medications wear “do not disturb” sashes, which has caused errors to drop noticeably. A striking study in the New England Journal of Medicine showed that surgical errors and complications fall by one-third if hospitals use a simple safety checklist before, during and after surgery.

Tuesday, May 12, 2009

Protection Payments: Licensed vs. unlicensed radio rights

I have just realized the blindingly obvious: the main value of a radio license is the right not to be interfered with, rather than the right to transmit.

This claim should be testable by establishing the degree to which the protection against interference influences the prices of licenses sold at auction. I’m working with Johnny Chan at the University of Washington to generate some results in this area. It’s certainly true anecdotally; M2Z has argued that T-Mobile knew its AWS-3 license, which had an adjacent band which would generate more interference, was worth less and so paid less at auction.

Proponents of license auctions charge that unlicensed allocations mean that “people” (they’re thinking of Google and Microsoft) are getting something without paying for it. It’s true that users of unlicensed radios don’t pay for a license, and it’s also true that both kinds of licenses confer some permission to operate a radio.

But there’s a big difference: a licensee can stop others from interfering with their operation, whereas an unlicensed user not only may not interfere with licensees, but also has to accept interference from all comers.

The big difference between an exclusive-use license and an unlicensed regime is excludability rather than autonomy, to use terminology I defined in an earlier post (Protecting receivers vs. authorizing transmitters). (Regarding a property, exclusivity means an owner can control what other people do, while autonomy allows an owner to act without hindrance.)

However, since radio licenses are defined in terms of transmission rights rather than receiver protections, what’s being sold is autonomy rather than exclusivity.

In practice there is a gamut of license types, with increasingly strong excludability rights: from unlicensed, to licensed by rule, to secondary licenses, and then primary licenses. The more excludability you get, the more a license should be worth. We’re planning to do regression analysis on US auction results to see if this is the case.

If, as we’re working to show, the main benefit of a radio license is protection from interference rather than the right to transmit, then current radio policy is misconceived in focusing on transmit rights rather than receiver protection rights. While it’s true that defining transmit rights implicitly defines the receiver rights (again, see Protecting receivers vs. authorizing transmitters), not making receiver rights explicit guarantees downstream conflict, as the M2Z/T-Mobile argument over AWS-3 has shown.

Monday, May 04, 2009

A view on the policy making stream

BusinessWeek writes that IBM is pushing “stream computing”, which is processing incoming information on the fly rather than putting it in a database first, and then mining it.

I’ve been trying to mine information in the FCC’s Electronic Comment Filing System (ECFS), the repository for all interactions that petitioners have with the agency. The BW story got me thinking what one could do if updates to ECFS were easily accessible on the fly, along the lines of the proposal by Ed Felten and colleagues that government should expose underlying data rather than creating portals.

One could do a lot with just the metadata, that is, cover information on who submitted a document to ECFS. A little extra processing to, say, extract information from the filed documents on all the people present in a meeting, would add a great deal of value. One could also extract information about what topics are being discussed by doing semantic analysis of comments and reports of meetings between petitioners and the agency.

Some things researchers (not to mention commercial information providers) could do with this kind of intelligence:

Track the ebb and flow of meetings related to a particular proceeding

Be notified when a specific company, company in a coalition, etc. reports a meeting with the agency, and see it in the context of other meetings by opponents and allies

Put a watch on the meetings in a particular bureau of the agency

Track the personalities – who’s meeting with whom, who hasn’t been seen lately, who seems to be a rising star. I’ve been told that John de Figuieredo predicted the importance of William Kennard before he was tapped for the FCC by noticing that he was in a lot of key lobbying meetings. (Caveat: I may have misremembered the characters in this anecdote. Please correct me if you know better...)

Given time series information one could develop leading indicators for when a proceeding was heating up, or when something big was brewing.

Of course, the Garbage In, Garbage Out Rule applies; if petitioners file late, or misrepresent their interactions (i.e. lie), all the stream computing in the world will be for naught. We may need a suggestion I heard from Bob Pepper, a former FCC staffer now at Cisco: make petitioners warrant that their submissions are true, on penalty of perjury. Curiously, there is apparently no requirement for petitioners to tell the truth, and no penalties if they lie.

Thursday, April 30, 2009

The “business ecosystem” subtext

A feature in the new Christian Science Monitor on restoring the Galápagos to their state before the invasives arrived – rats, dogs, lizards, and especially humans – suddenly revealed to me why the “business ecosystem” rhetoric makes me uneasy.

Here’s the key passage:
“If an ecosystem is a community of life forms that have evolved together and achieved equilibrium, then the restoration of that ecosystem begins with the removal of everything that upsets the balance.”
Users of the “business ecosystem” metaphor perhaps aren't even conscious that their goal is equilibrium, but I’ve now realized that it’s a foundation of this world view. Everybody needs stability in their lives, even when they also crave novelty; this is particularly true for large technology companies.

Catastrophe is as much a part of complex system behavior as continuity, but it's something we'd rather not think about too much. Radical change is bad news for incumbents - and it's bad for all of us when the "incumbents" are rare plant and animal species on the edge of extinction - but it is good news for newcomers trying to make their mark and change the world.

P.S. Here’s the quote in a little more context:
Certainly, reconstructing nature is a prospect fraught with contradictions. Can it really be natural if it is created by human design?

Cruz and fellow conservationists operate on a simple formula: If an ecosystem is a community of life forms that have evolved together and achieved equilibrium, then the restoration of that ecosystem begins with the removal of everything that upsets the balance. And so, somewhat paradoxically, the conservation of Galápagan ecosystems inevitably starts with a meticulous campaign of eradication. Animals introduced by people must go. Once the slate is wiped clean, native species, some of which continue to exist only in captivity – like Lonesome George, the iconic giant tortoise who's the last of his breed – can be reintroduced. Then the community, a system of checks and balances honed to perfection over time – of grazing tortoises and plants, birds and seeds that need each other – can reestablish.

Friday, April 03, 2009

Visualization Literacy

Bommarito and Katz’s visualization of Senate campaign contributions is a wonderful demonstration of the potential for making large amounts of government information accessible.

Having focused successively on campaigns to improve literacy, then media literacy, then design literacy, compelling work like this suggests that the time may soon come for "visualization literacy": the skills a citizen needs to evaluate the information presented via data visualizations.

Maps are a long-established visualization tool. They may purport to be value neutral, but of course are not. Depending on who’s paying, some maps show churches, and others show hotels. Every map embodies decisions to show some things and hide others, which means that every map is trying to persuade us to see the world in a certain way.

In the same way, more recent data visualizations have a more or less hidden agenda by virtue of their choices of what to show, and how to show it.

Looking deeper, the data being visualized is itself a subset of all possible information, and its collection is based on a model of the world that entails various biases. Data has an agenda, not only in what was collected, but in how it was gathered, and how it is categorized.

Finally, the interface that one has to use to access the data ("interface" as the set of commands and messages, not the visuals) has an agenda. If software code implements an architecture, as Larry Lessig would have it, then the code interfaces place bounds on the architecture. Even if all data were accessible with a given interface, some things will always be easier to do than others. This biases not only the data that is represented, but also the ways in which it is represented.

Information at every level – from data selection, to interface calls, to visualization – comes with an agenda. By the “if I can imagine it, it’s already been done” rule, seminars in the semiotics of visualization have surely already sprung up.

Update 4 May 2009:

Courtesy SiliconValley.com, here's a recent example of how maps carry meaning: Historical maps of Japan from Berkeley's East Asian Library collection that were offered as layers that could applied in Google Earth have had to be sanitized to remove references to burakumin villages. David Rumsey, who oversees the Berkeley collection, acknowledged, "We tend to think of maps as factual, like a satellite picture, but maps are never neutral; they always have a certain point of view."

Tuesday, March 24, 2009

Lessons From Software For Patents, vs. Solving the Software Patent Problem

Software patents may be going the way of network neutrality: an arcane policy problem once the preserve of a small circle of wonks is becoming a politicized slanging match. In both cases an esoteric but important research question has become a point of leverage for certain interest groups. In both cases the subject (“network neutrality”, “software patents”) is at best poorly defined, typically has multiple possible meanings, and at worst is so vague as to be useless. And in both cases, the poster child is the small-time innovator, while the sugar daddy is a big money player minimizing costs (e.g. content providers who love net neutrality, and VCs who hate software patents).

I was fortunate to attend the Silicon Flatirons conference on Evaluating Software Patents last week. The legal scholars there agreed that there were many, incompatible ways to define software patents, and the practitioners agreed that even if a definition were stipulated, they’d find a way around any additional burdens imposed by its use.

However, good arguments were made that software has added something new to the intellectual property mix. None of the following attributes of software are decisive, but together they point to changed dynamics:
There is a very high likelihood of infringement when producing a software-based product since so many patents are implicated in any application

There is a large group opposing software patents (whatever they are) because it undermines their business model, notably the open source / free software movement

Unlike many other inventions, software can also be protected via copyright

A very large proportion of current patent applications involve software

Software-related products are more intangible than traditional mechanical inventions

Programmers as a community are more hostile to the use of patents than other inventors
As I understood the observations of the legal scholars (John Duffy, Mark Lemley, and Michael Meurer – apologies for lumping their views together) it didn’t matter if “software” patents weren’t a definable category; new legal doctrines were required to address the new problems raised by software. For example, a rapidly moving industry like software has a more pressing need for a high standard of obviousness than earlier technologies of more placid times; and the problem of inadvertent infringement needs to be addressed on its own terms, and not just for “software” patents.

Prof. Lemley also pointed out that over the last three years, the courts have fixed most of the problems that have been grist for the debate. Legislation and reform of the patent office will be a long time coming, and we shouldn’t – and don’t need to – wait for them.

The lesson generalizes: rather than tie new methods of governance to the particular technologies or industries that give rise to new problems, one should abstract the problems and solve them generically. Now if only that had happened with network neutrality…

Tuesday, March 03, 2009

Two-way transparency

“Transparent government” is the watchword these days – but it’s the transparency of the proscenium arch. The curtain has been drawn aside a little and we can watch the players, but they care little and know less about what’s going on in the audience. The groundlings aren’t asked to shape the play.

It’s important for citizens to be able to see into government; but it’s just as important for government to understand what citizens want. And in a democracy, it’s most important for citizens to influence government.

Web 2.0 is giving participatory democracy a fillip, as online social networks are drafted into energizing voters. However, much of the “we’re listening to you” is still theater: citizens are asked to submit YouTube videos, and a select few are played to simulate that someone is paying attention.

It’s not (just) that politicians don’t want to listen; making sense of the individual opinions of thousands or millions of people is very hard to do in a nuanced way. The dominant method is still counting noses, whether in an election, an opinion poll, or keeping track of how calls from constituents are splitting on a contentious issue. Potential knowledge is boiled away, leaving only numerology at the bottom of the pot.

Advanced computation can help make sense of citizen input. Semantic analysis tools developed to filter spam, mine search queries, collate machine-submitted bug reports, and extract signals intelligence can be applied to provide a narrative. Old technologies should be still be used – and used more intensively. Regulatory agencies should poll citizens, and not just depend on lobbyists and lawyers to tell them what’s important. ICT can also turn citizen input from a burden to a blessing if it becomes a cost-effective way to leverage democratizing innovation into innovative democracy, using all the social networking and idea market tools of Web 2.0.